MyDoc
UX/UI Design
November 2023
Project Details
Tools Used
Figma
Adobe Illustrator
Problem
Brief
I was tasked to design an interface for patients and physicians to collect, organize, and analyze health information. My designs were to showcase strong information architecture and visual design that reflects the [redacted]'s bright, joyful, and whimsical personality.
Users
Michael Atwell
A 65-year-old who was recently diagnosed with hypertension (high blood pressure). Two weeks ago, his doctor put him on a new medication, atenolol, and set him up with a smart blood pressure cuff for home monitoring. His daily blood pressure readings are synched with his medical record via his smartphone. Michael is fairly comfortable with consumer technology, but he's no expert. He uses Zoom and Facetime regularly to talk with his friends and family
Dr. Teresa Washington, M.D.
Michael's primary care physician. She specializes in internal medicine and regularly treats patients like Michael for hypertension, so she is well-acquainted with multiple treatment options. She's used electronic medical record software for over a decade, but only recently has started doing telemedicine (providing care remotely over video). Because she uses computers so much for work, in her free time, she likes to unplug.
Scenario
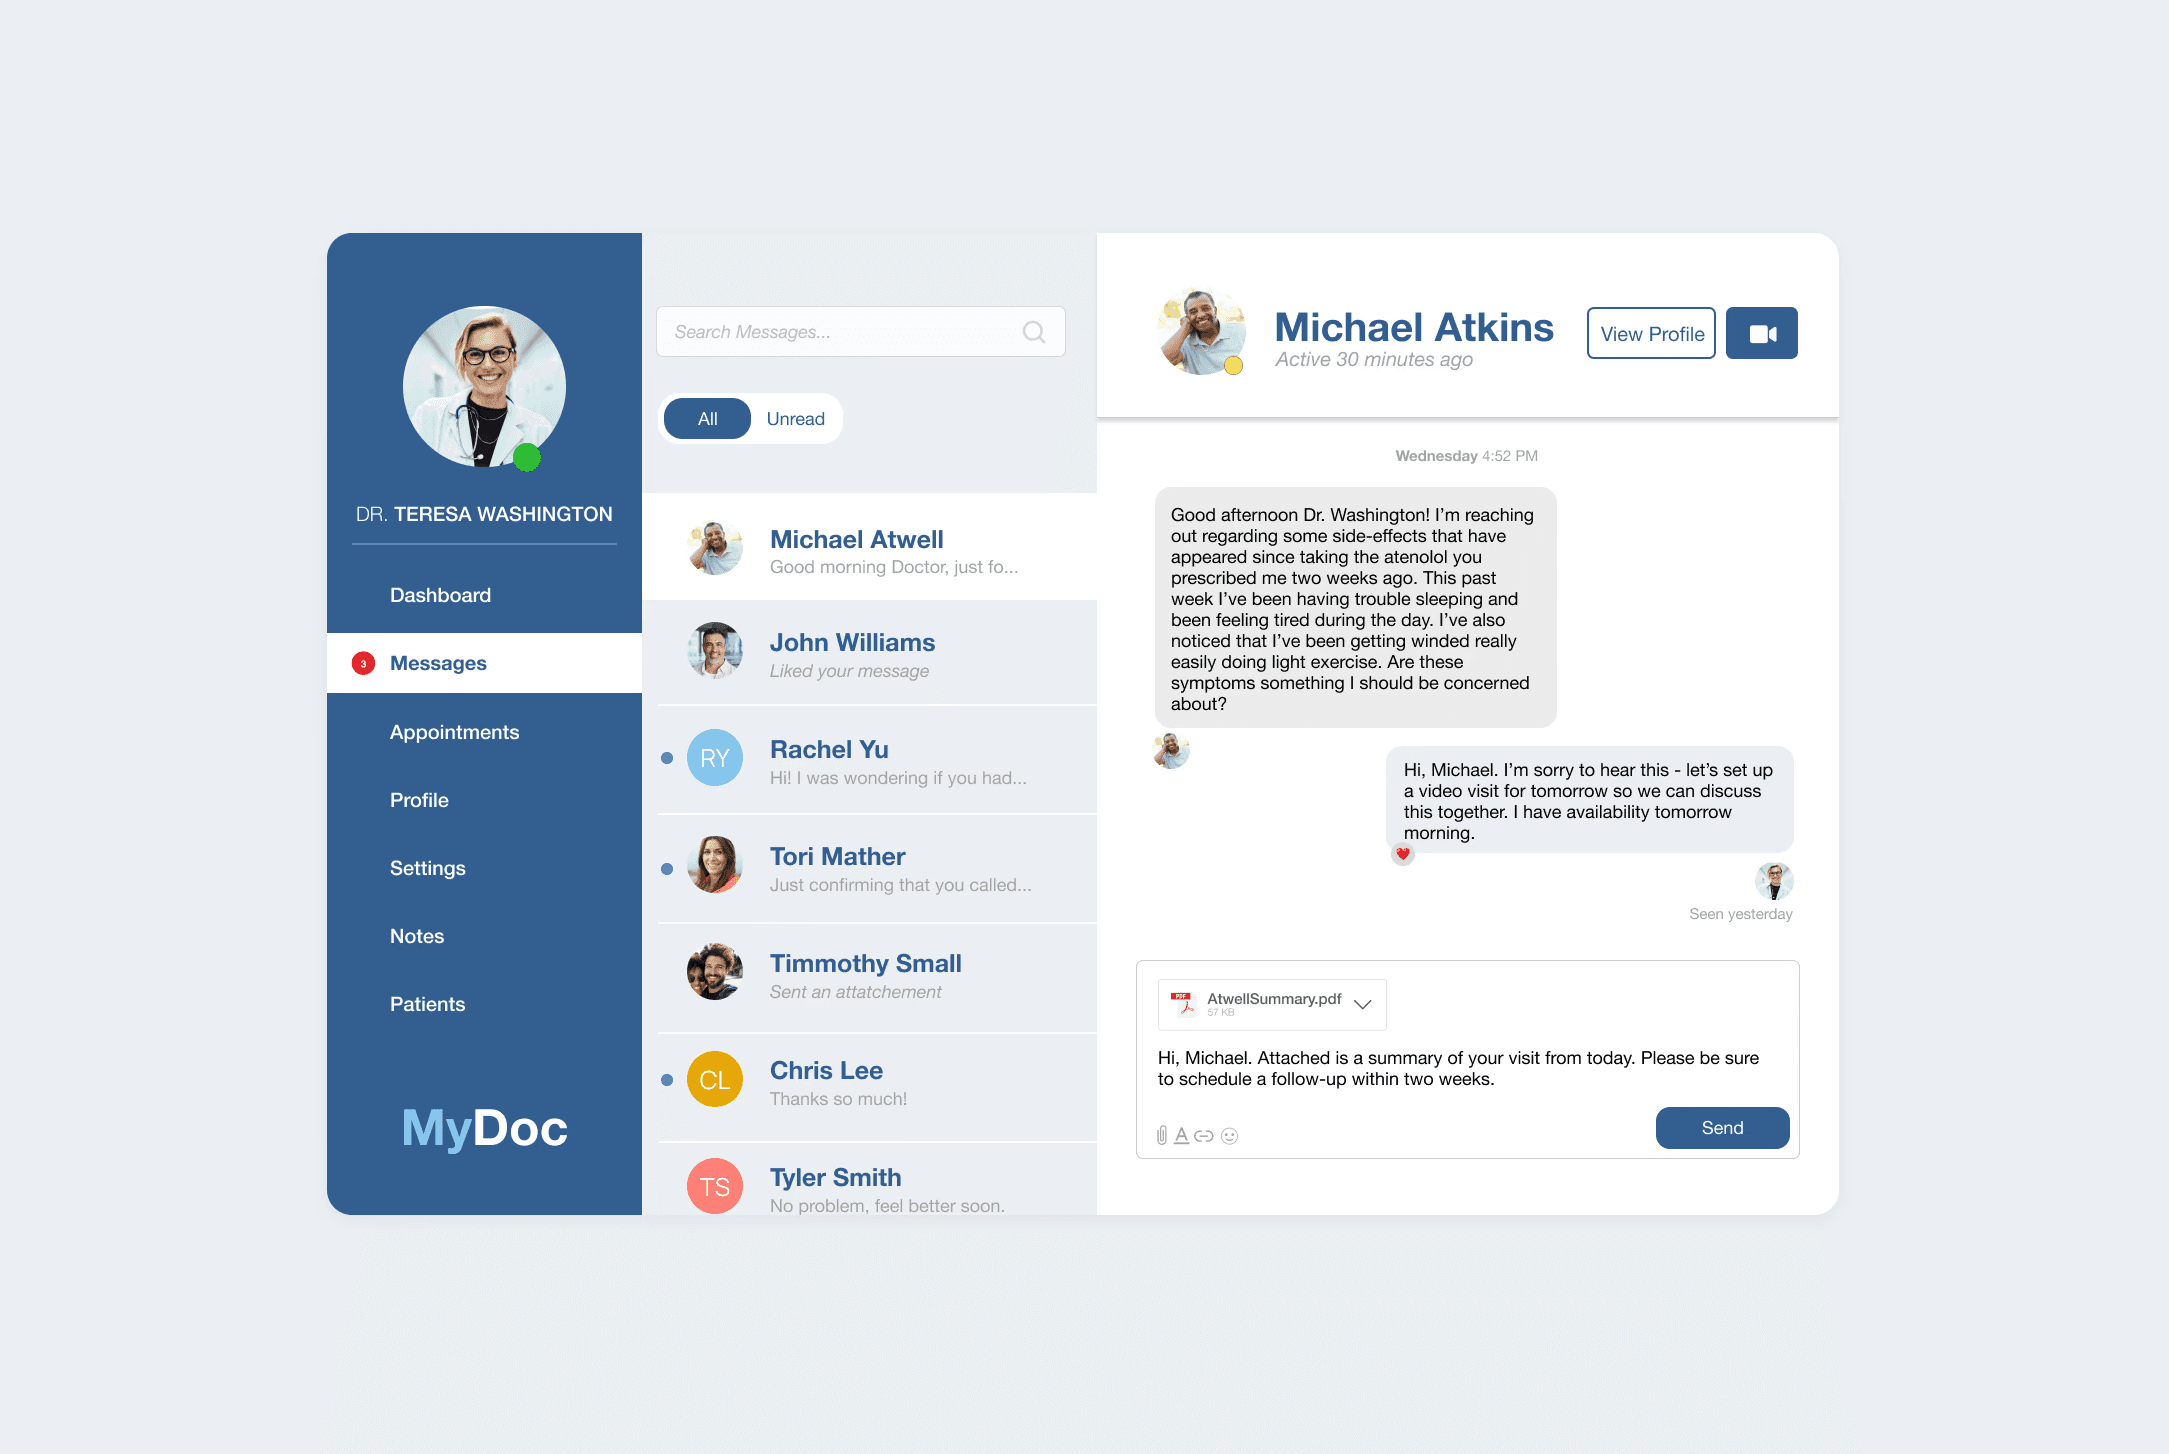
Since starting to take atenolol two weeks ago, Michael has had trouble sleeping and has felt tired during the day. He's also found that he gets winded really easily doing light exercise. He's worried about these side-effects and decides to send his doctor a message via the [redacted] app to let her know. Dr. Washington schedules a video visit for the next day so they can discuss the problem together.
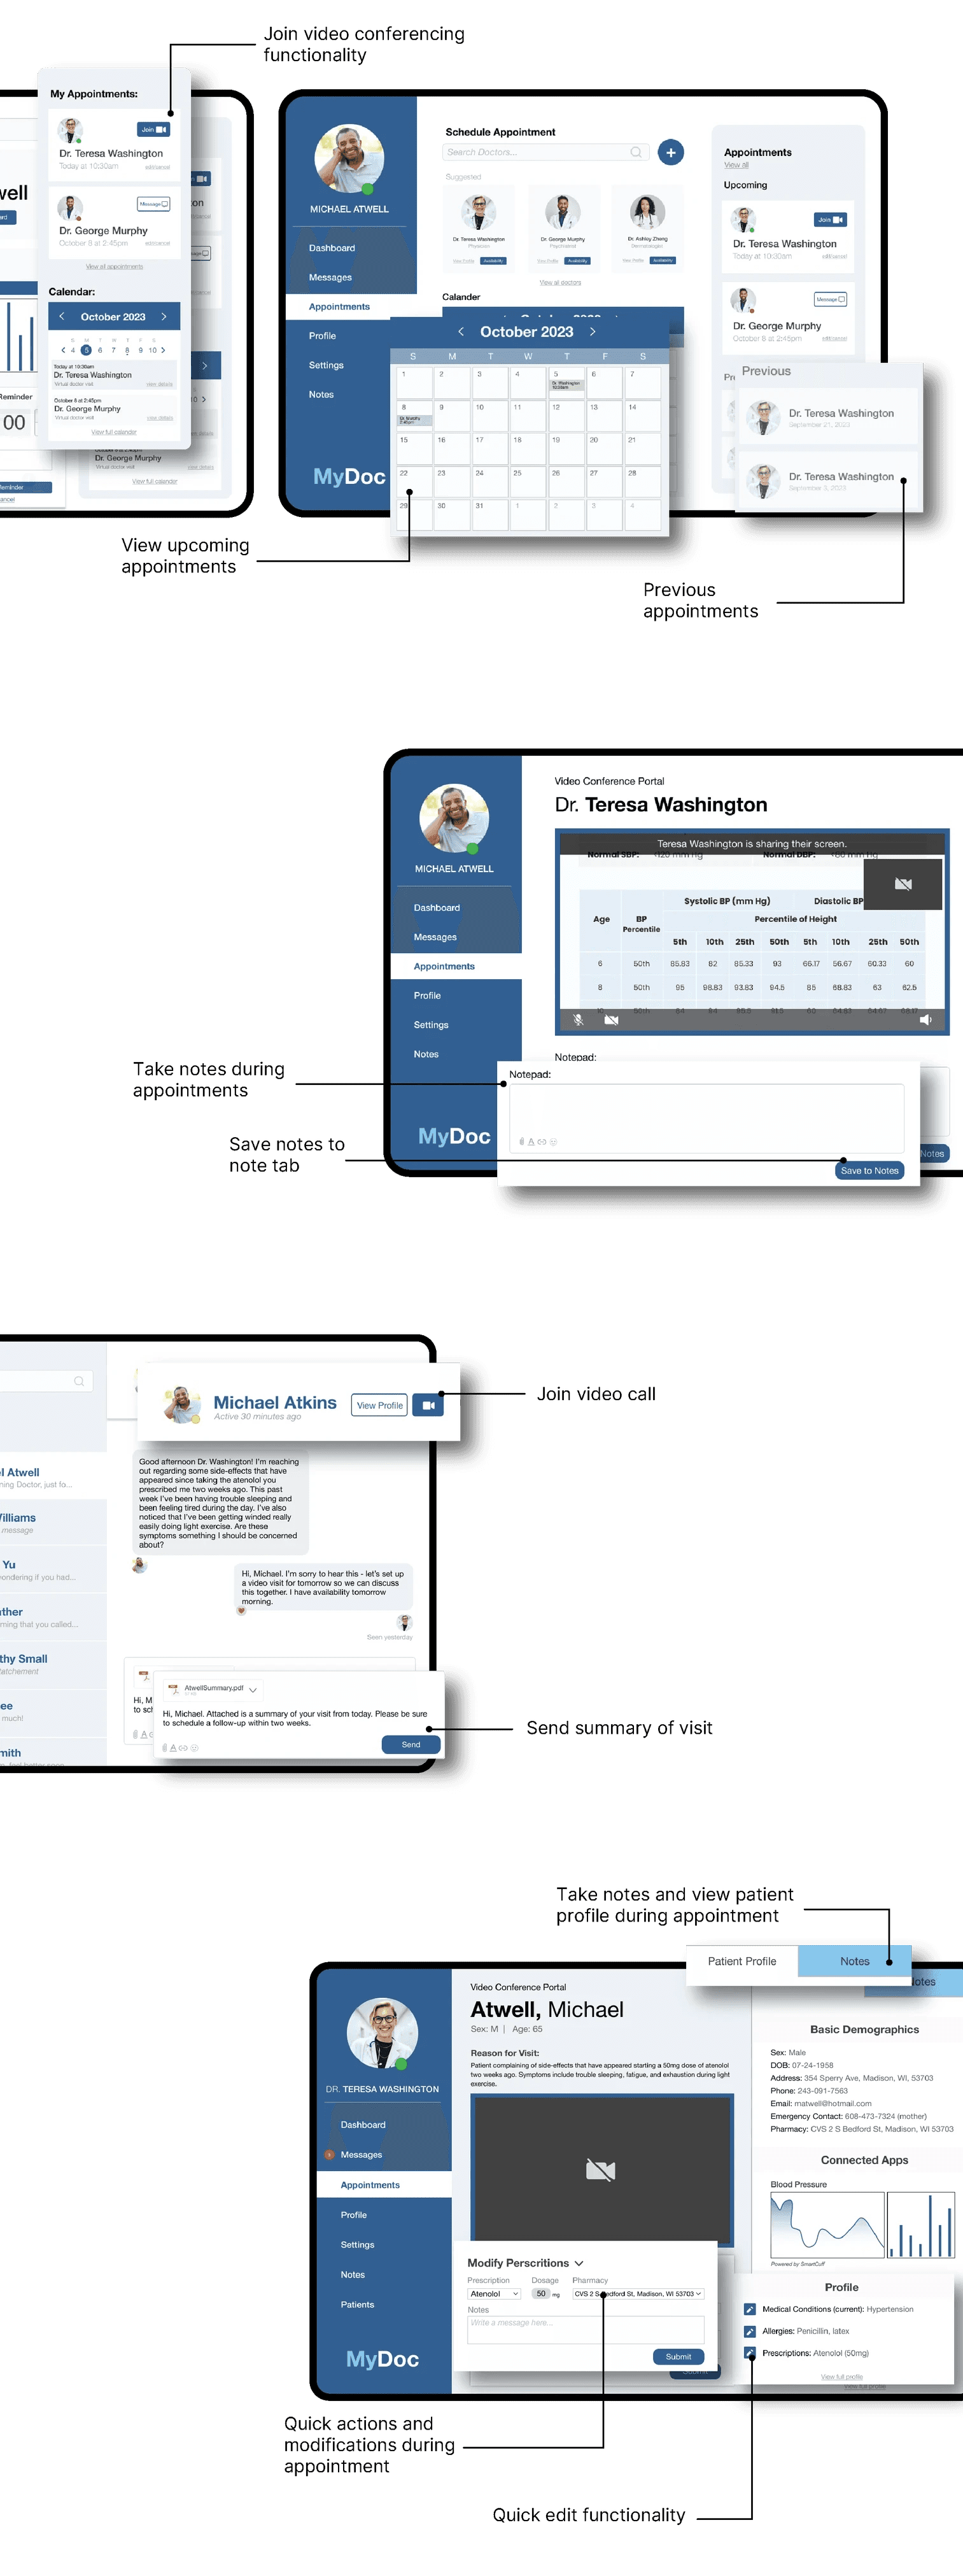
Michael and Dr. Washington meet via [redacted]'s telemedicine tool. Michael uses the [redacted] app on his iPad, and Dr. Washington uses the electronic health record software on her PC. After talking with Michael, reviewing his current medications, medical conditions, and the data from his smart blood pressure cuff (his blood pressure is going down, which is good!), Dr. Washington decides to lower his dose of atenolol from 50mg to 25mg.
Assignment
Design both Michael and Dr. Washington's user interfaces during the video visit.
Michael should be able to see:
Dr. Washington's video
Any pieces of information she wants to show him
A way to access standard video conferencing functionality
Show how Michael would use the app to:
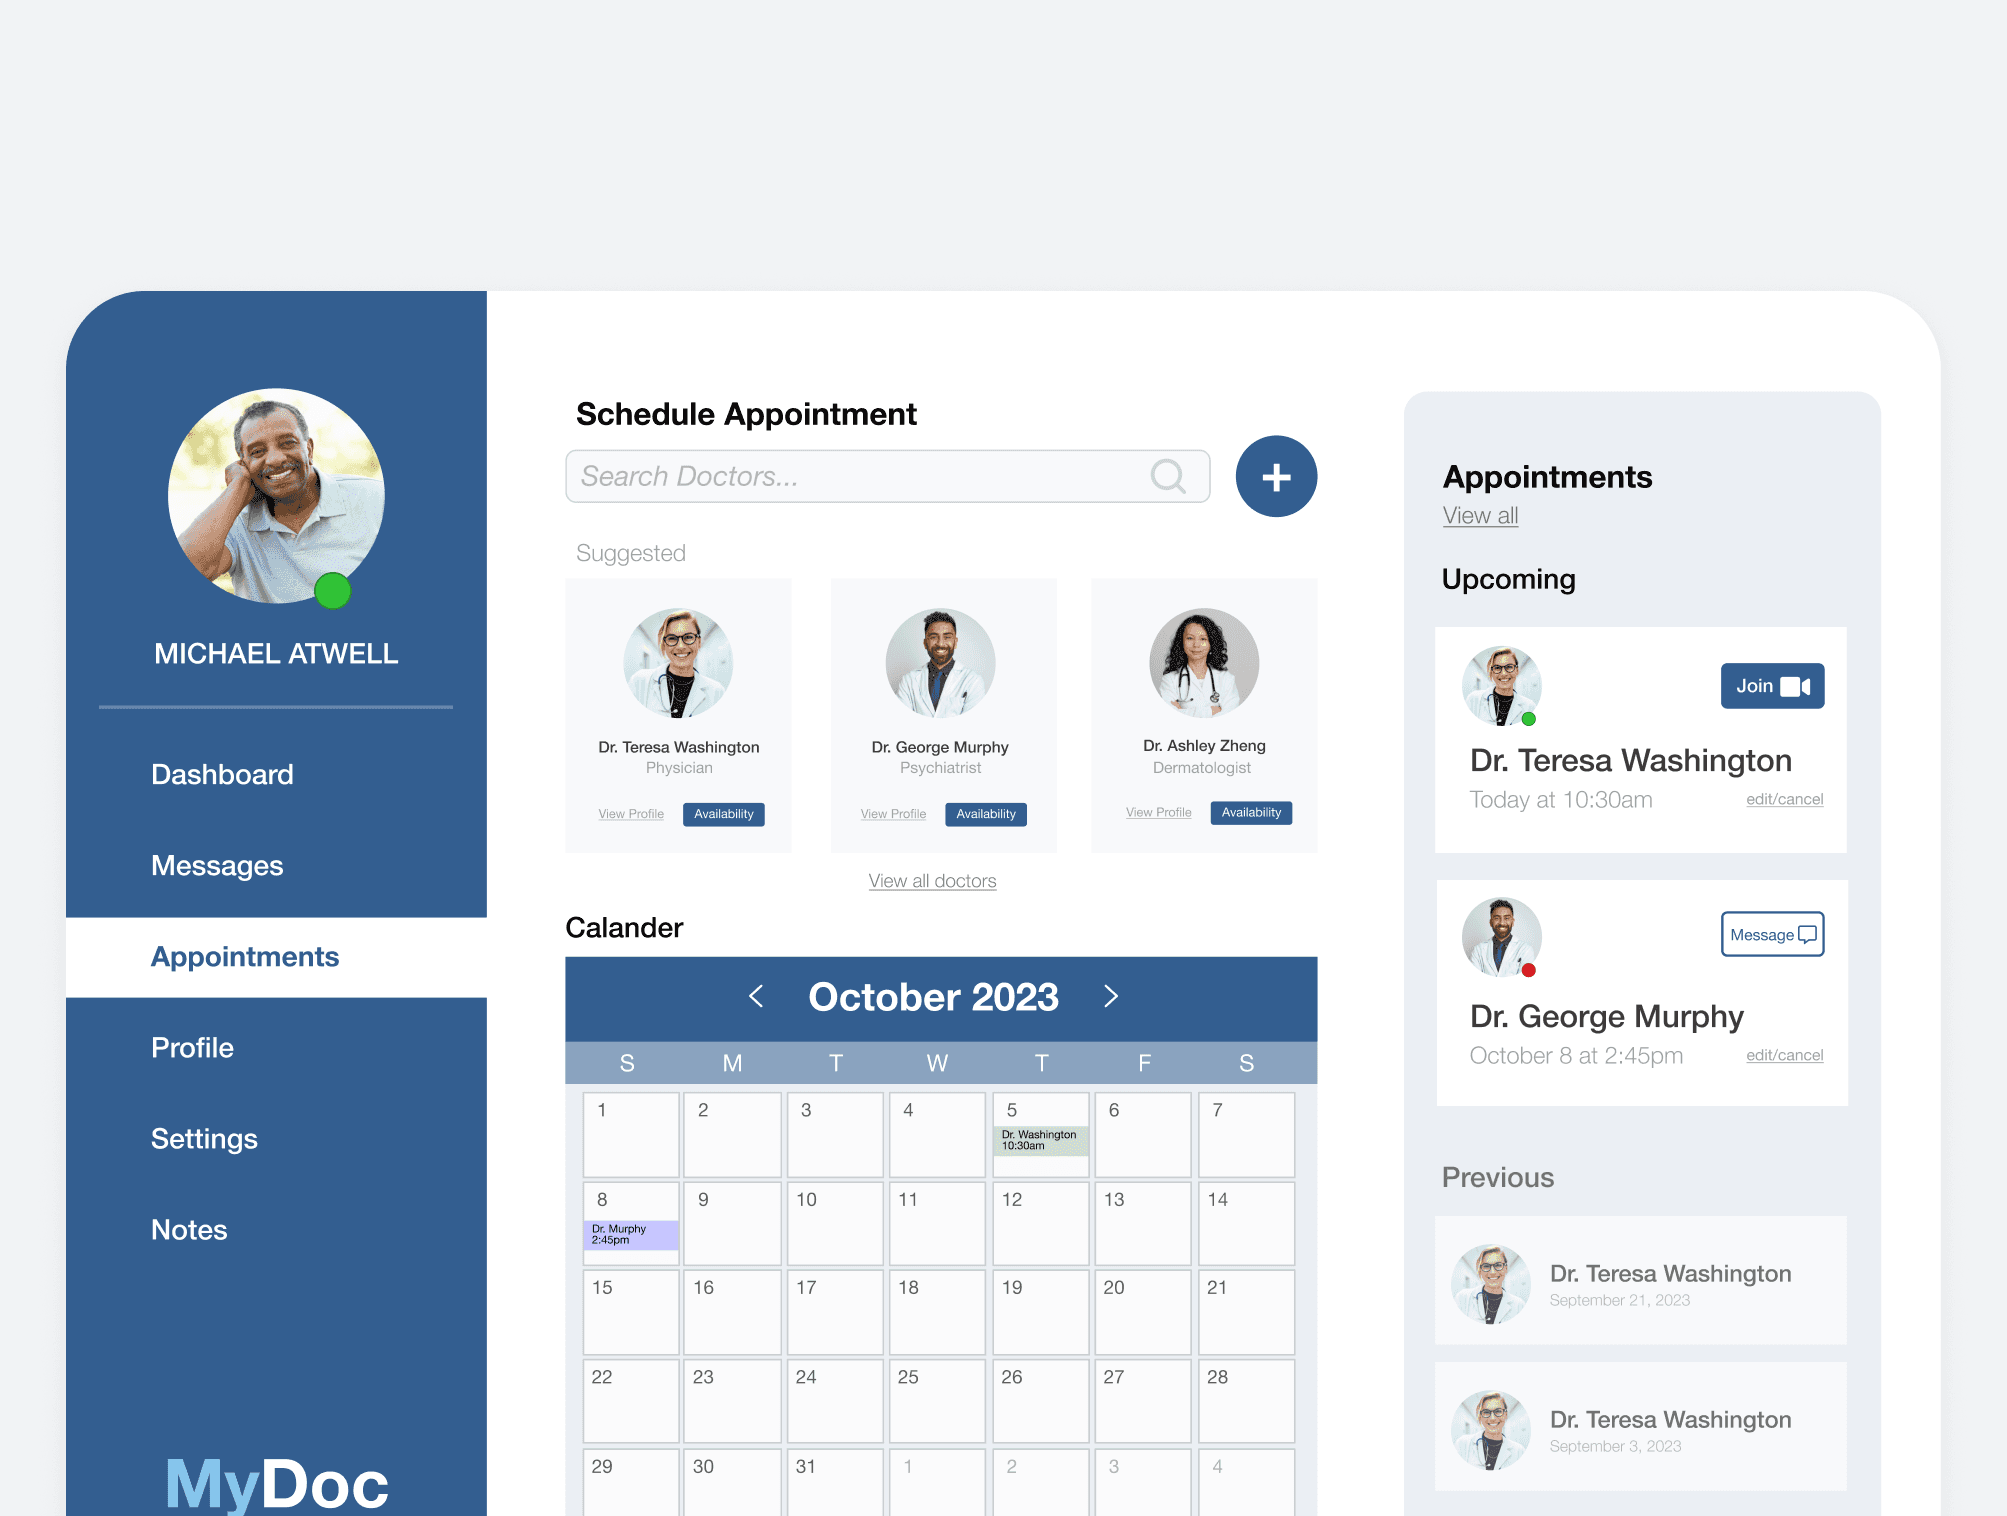
View his past and upcoming visits and launch the video visit
Take notes for himself during the visit
After the visit, set a reminder for himself to take his new medication with breakfast every day
Dr. Washington should be able to see:
Michael’s video
Basic demographics like name, birthdate, age, and sex
His allergies
The reason for this visit
His current medications
His current medical conditions
His blood pressure, trended over time
Show how Dr. Washington would use the software to:
Adjust the dose of atenolol from 50mg to 25mg
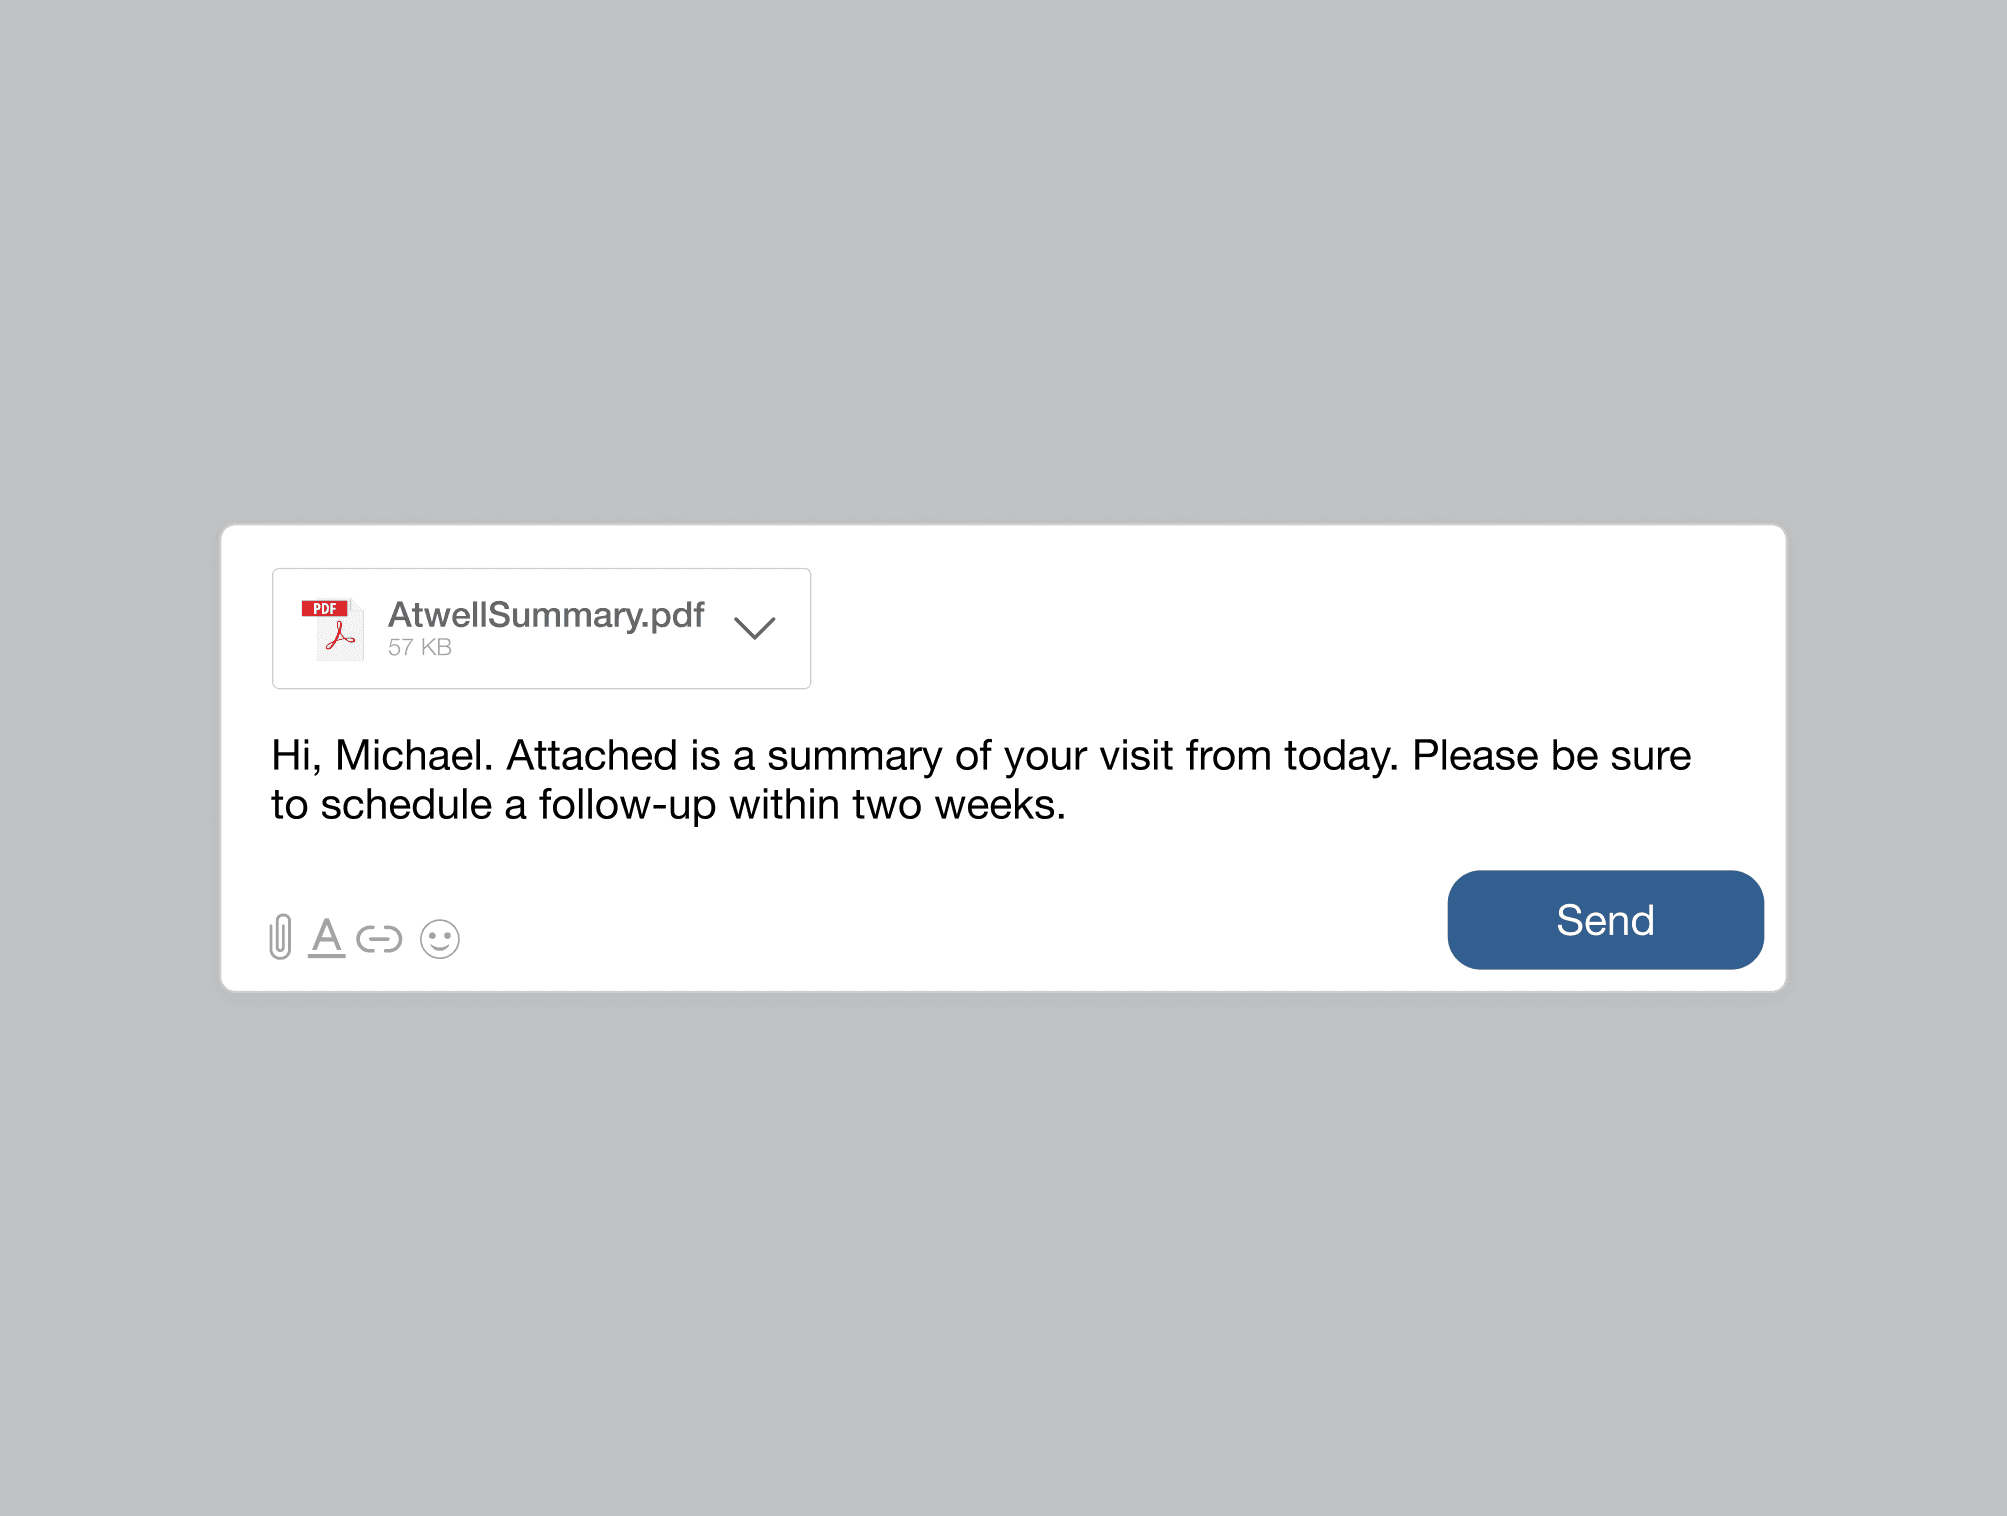
Send Michael a summary of the visit
Wireframes
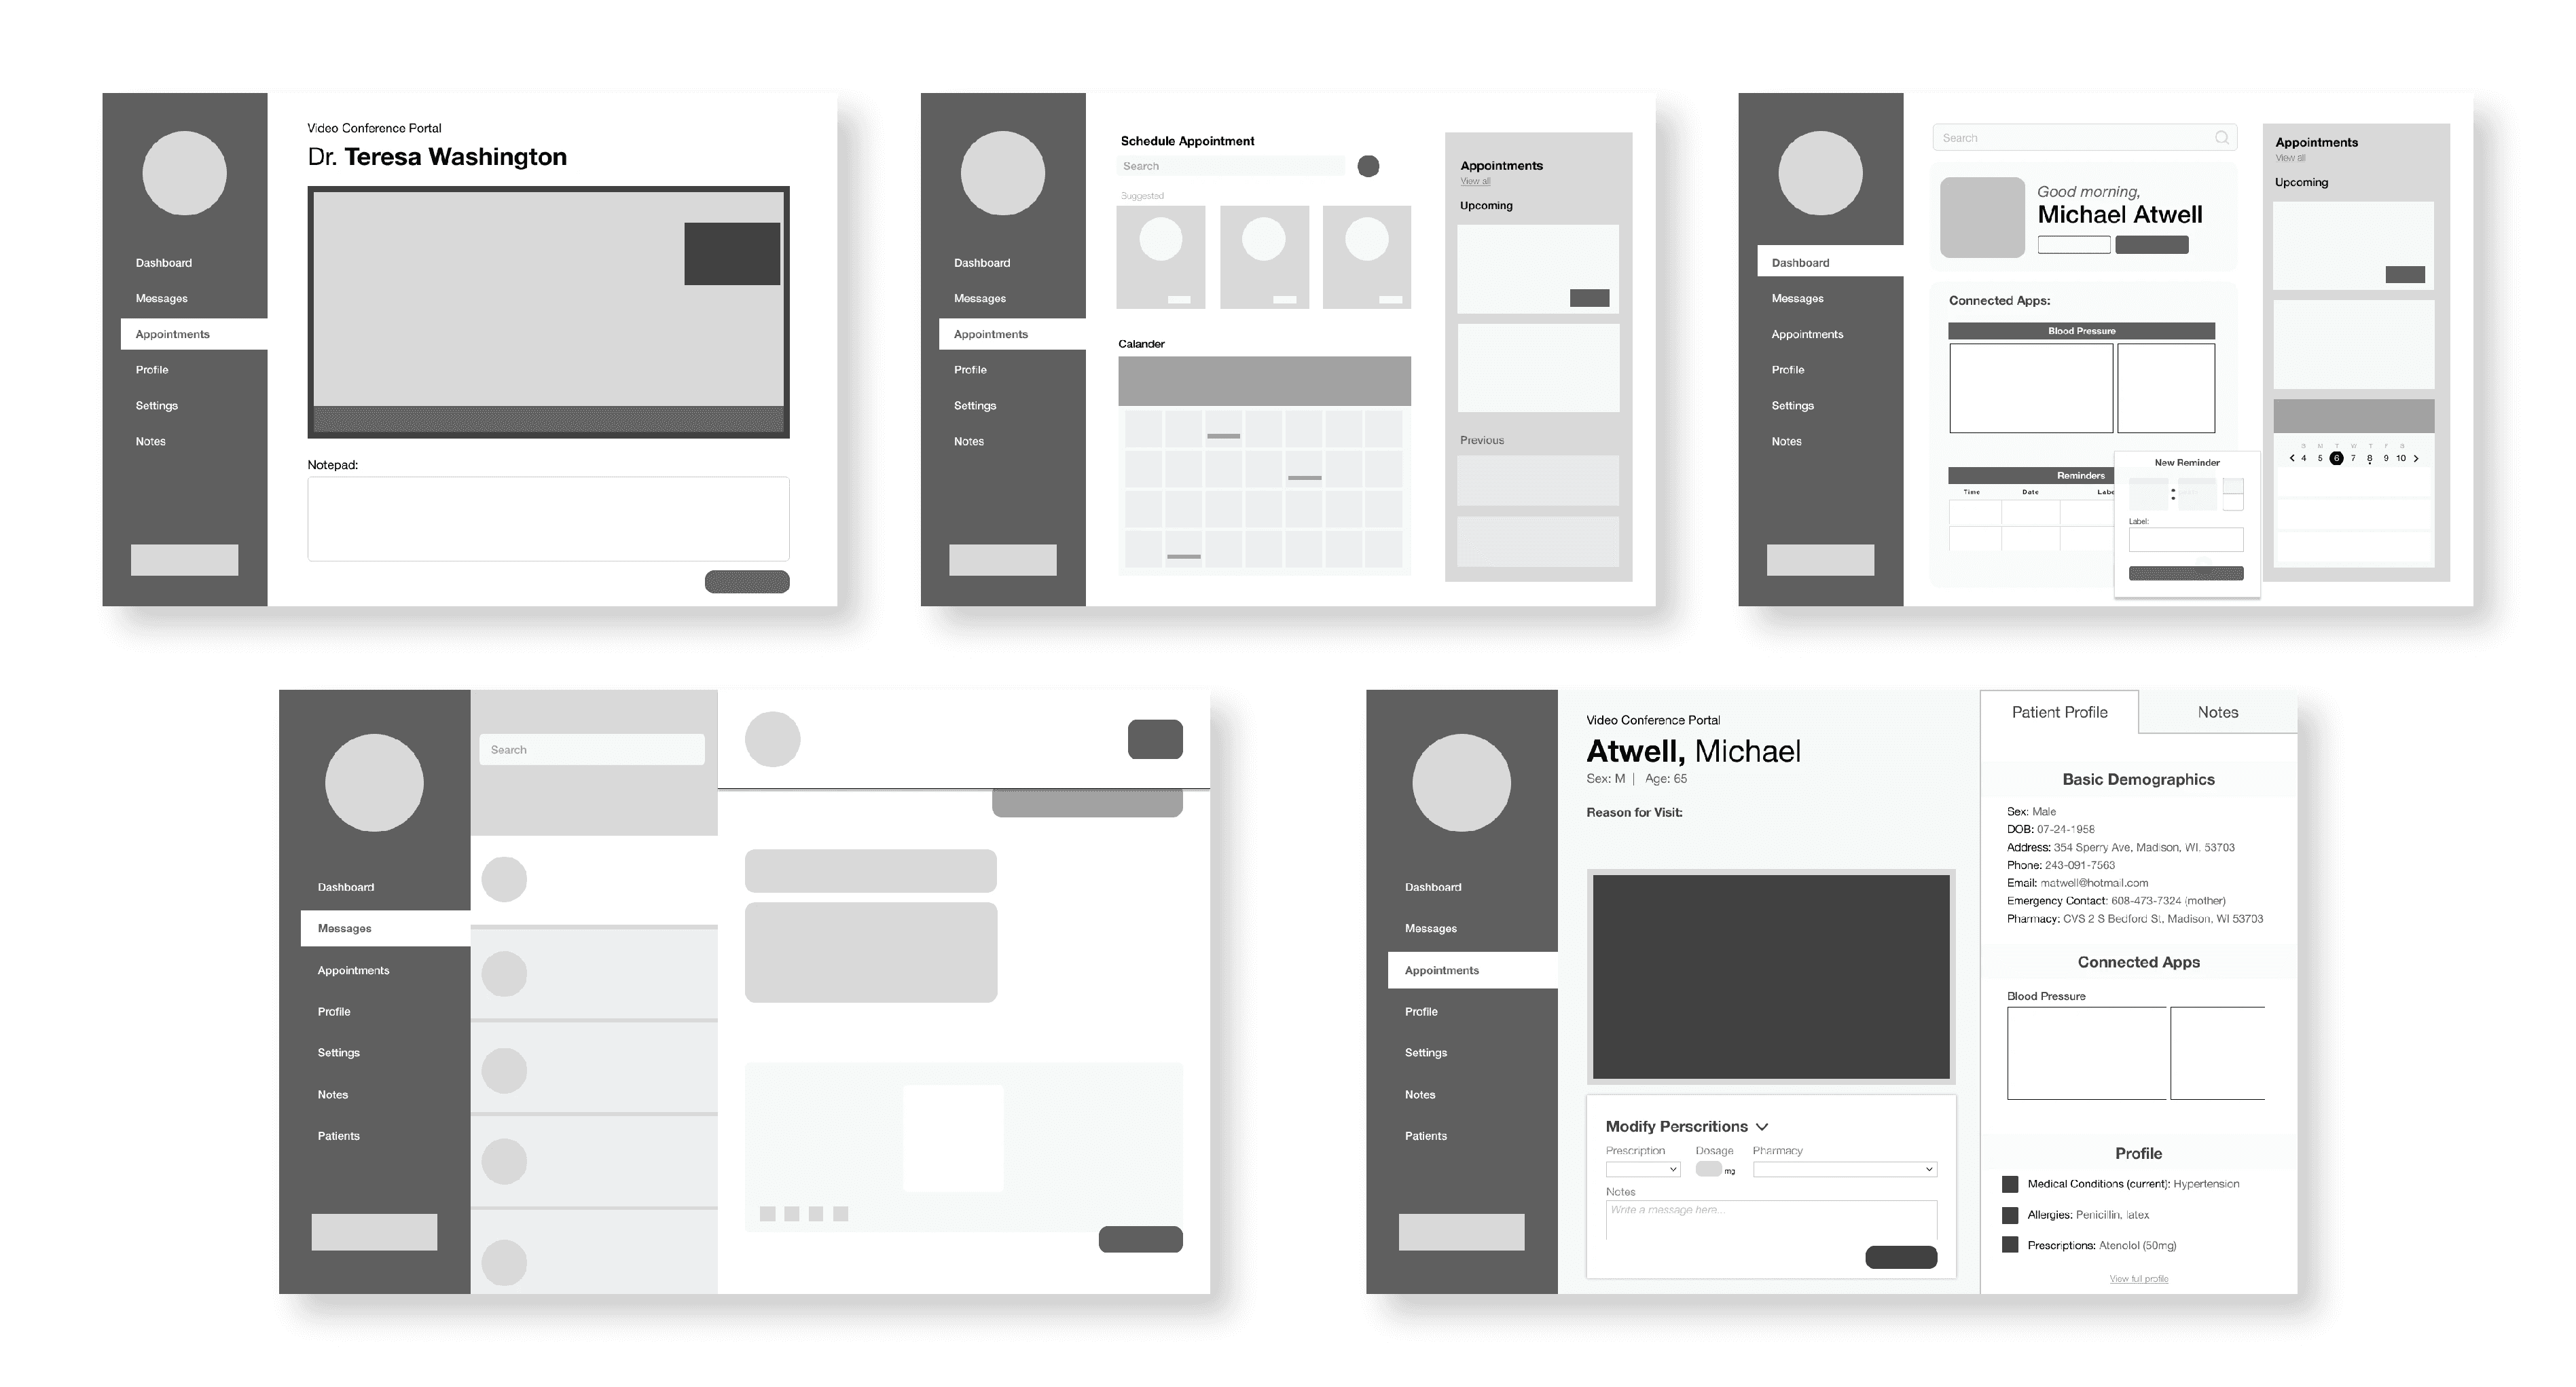
I started out by designing a layout in the format of a low fidelity wireframes.
Design System
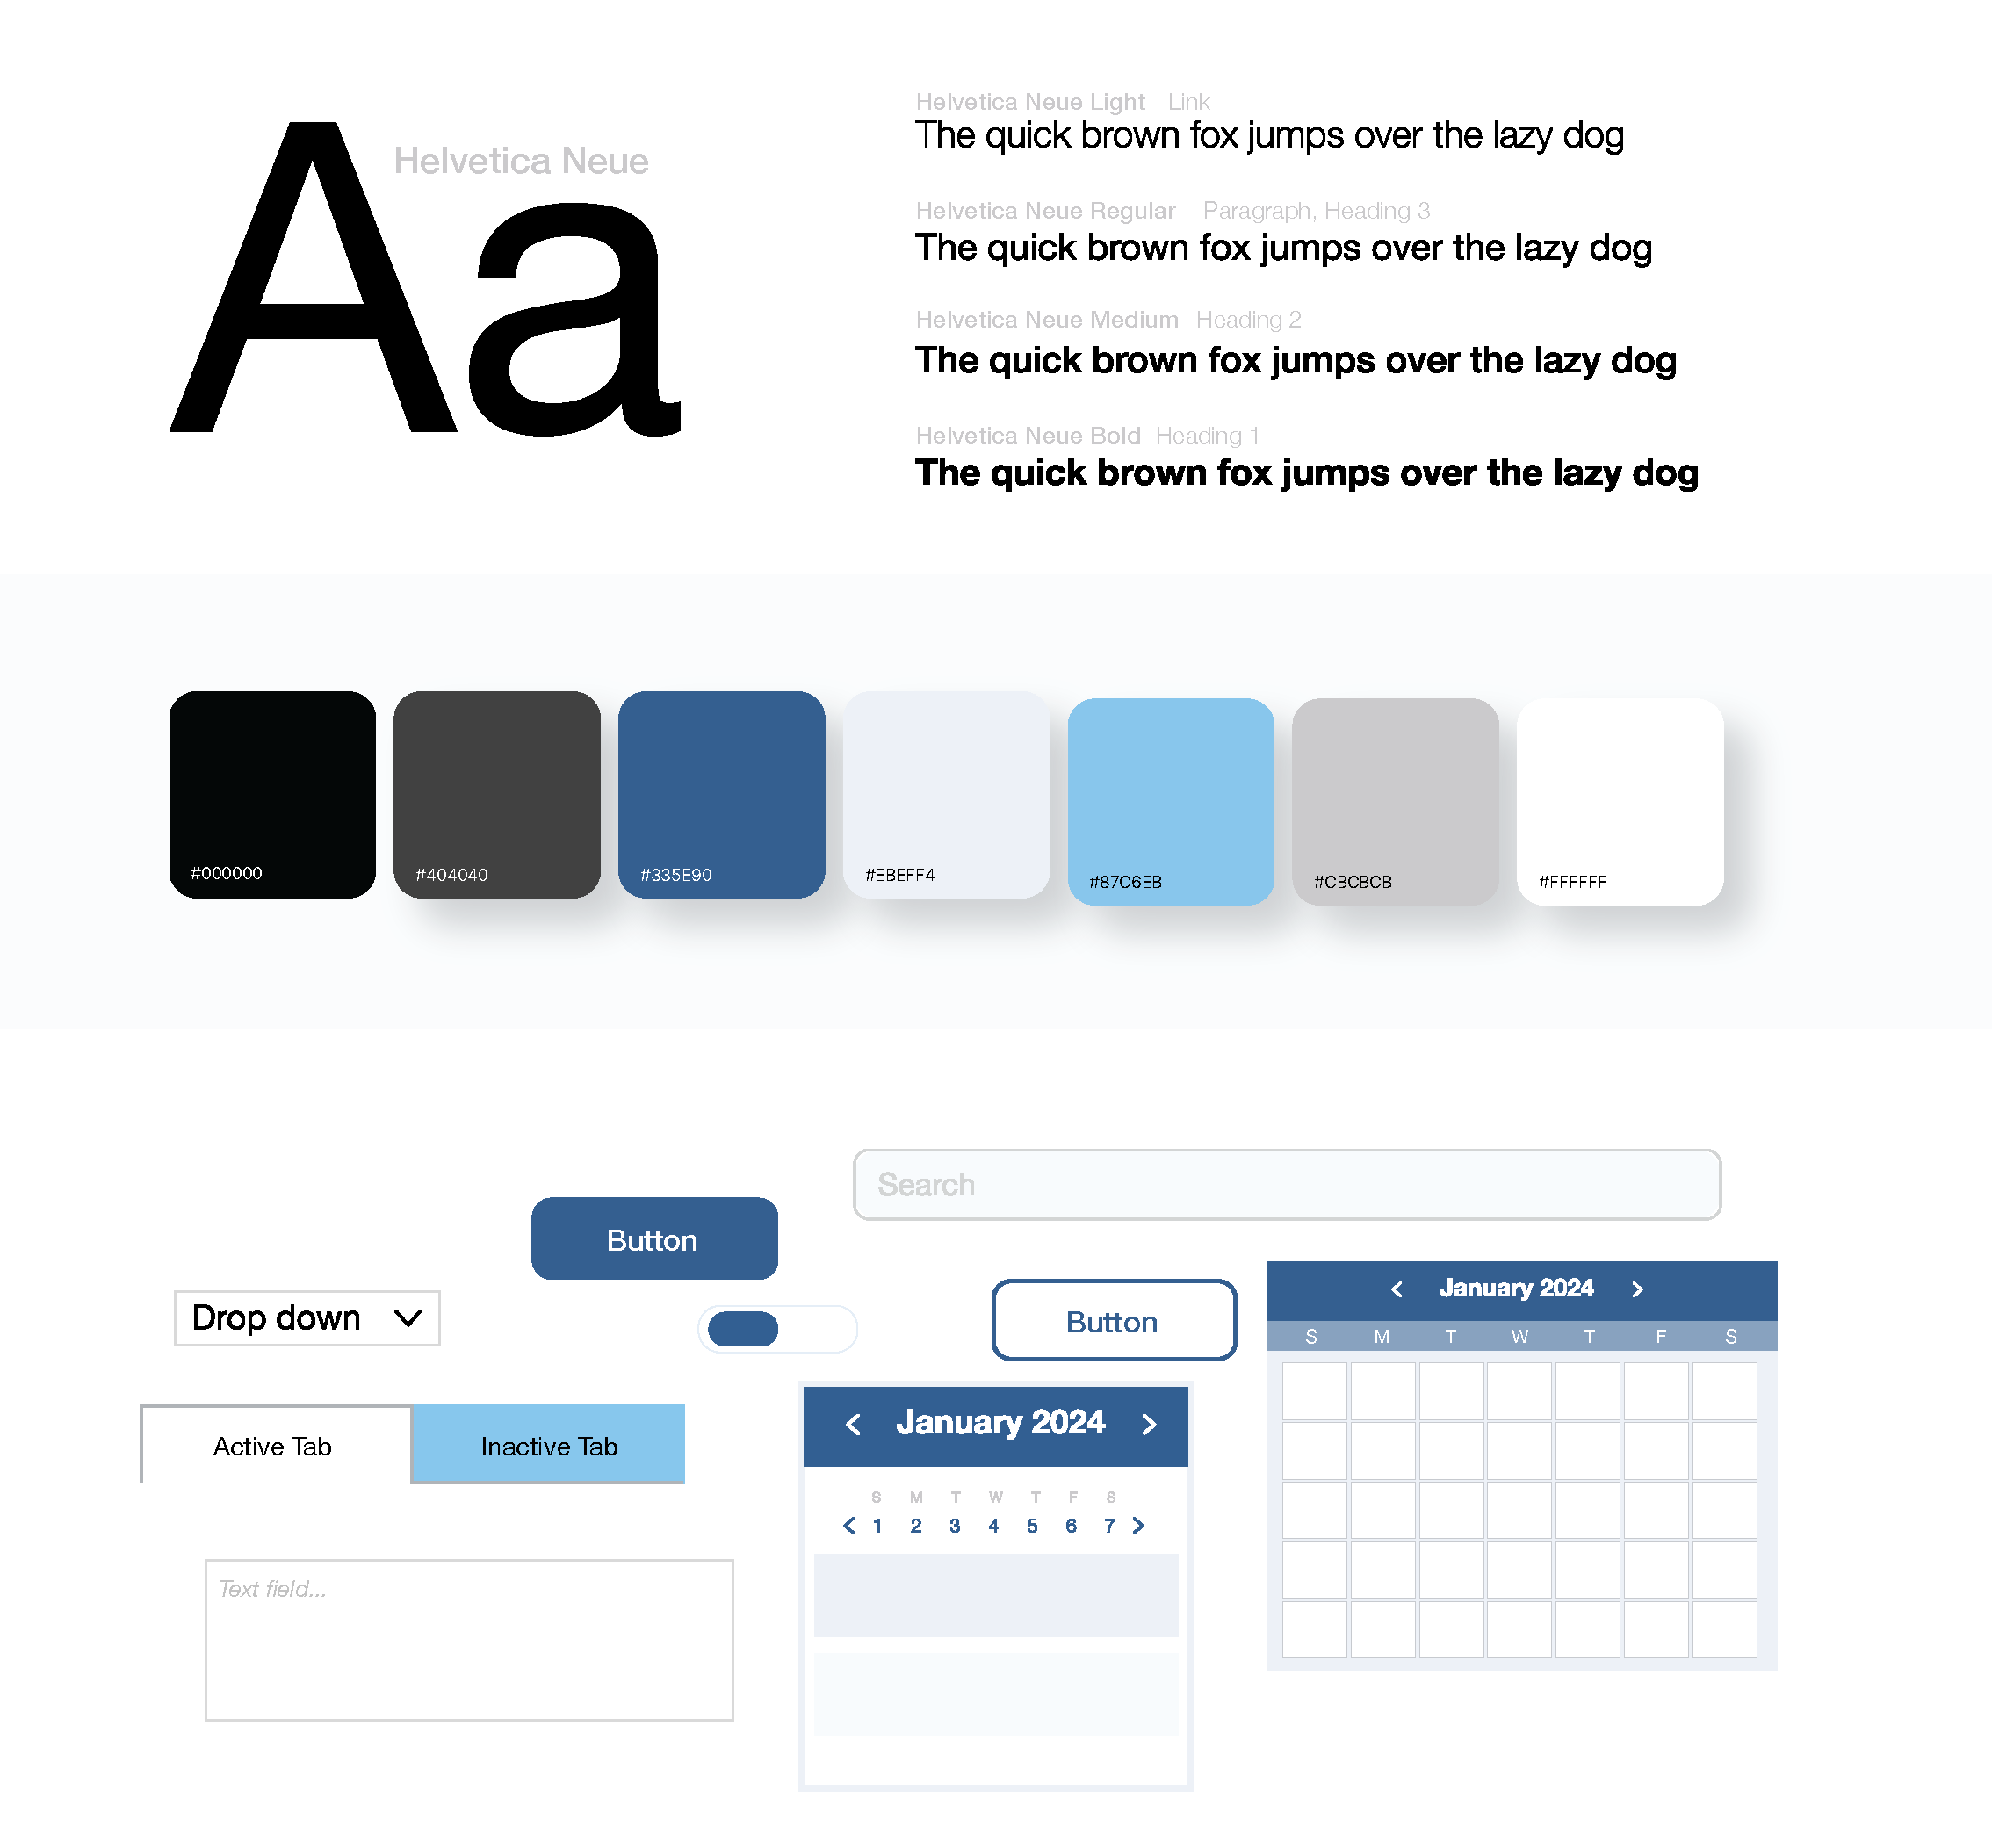
I created a styleguide that would reflect the app's bright personality while also presenting information in an organized, cohesive, and legible manner.
Design Solutions
After constructing a layout when creating a low-fidelity wireframe I designed a high-fidelity prototype of the software that incorporated all features and functionality outlined in the brief.
